Description
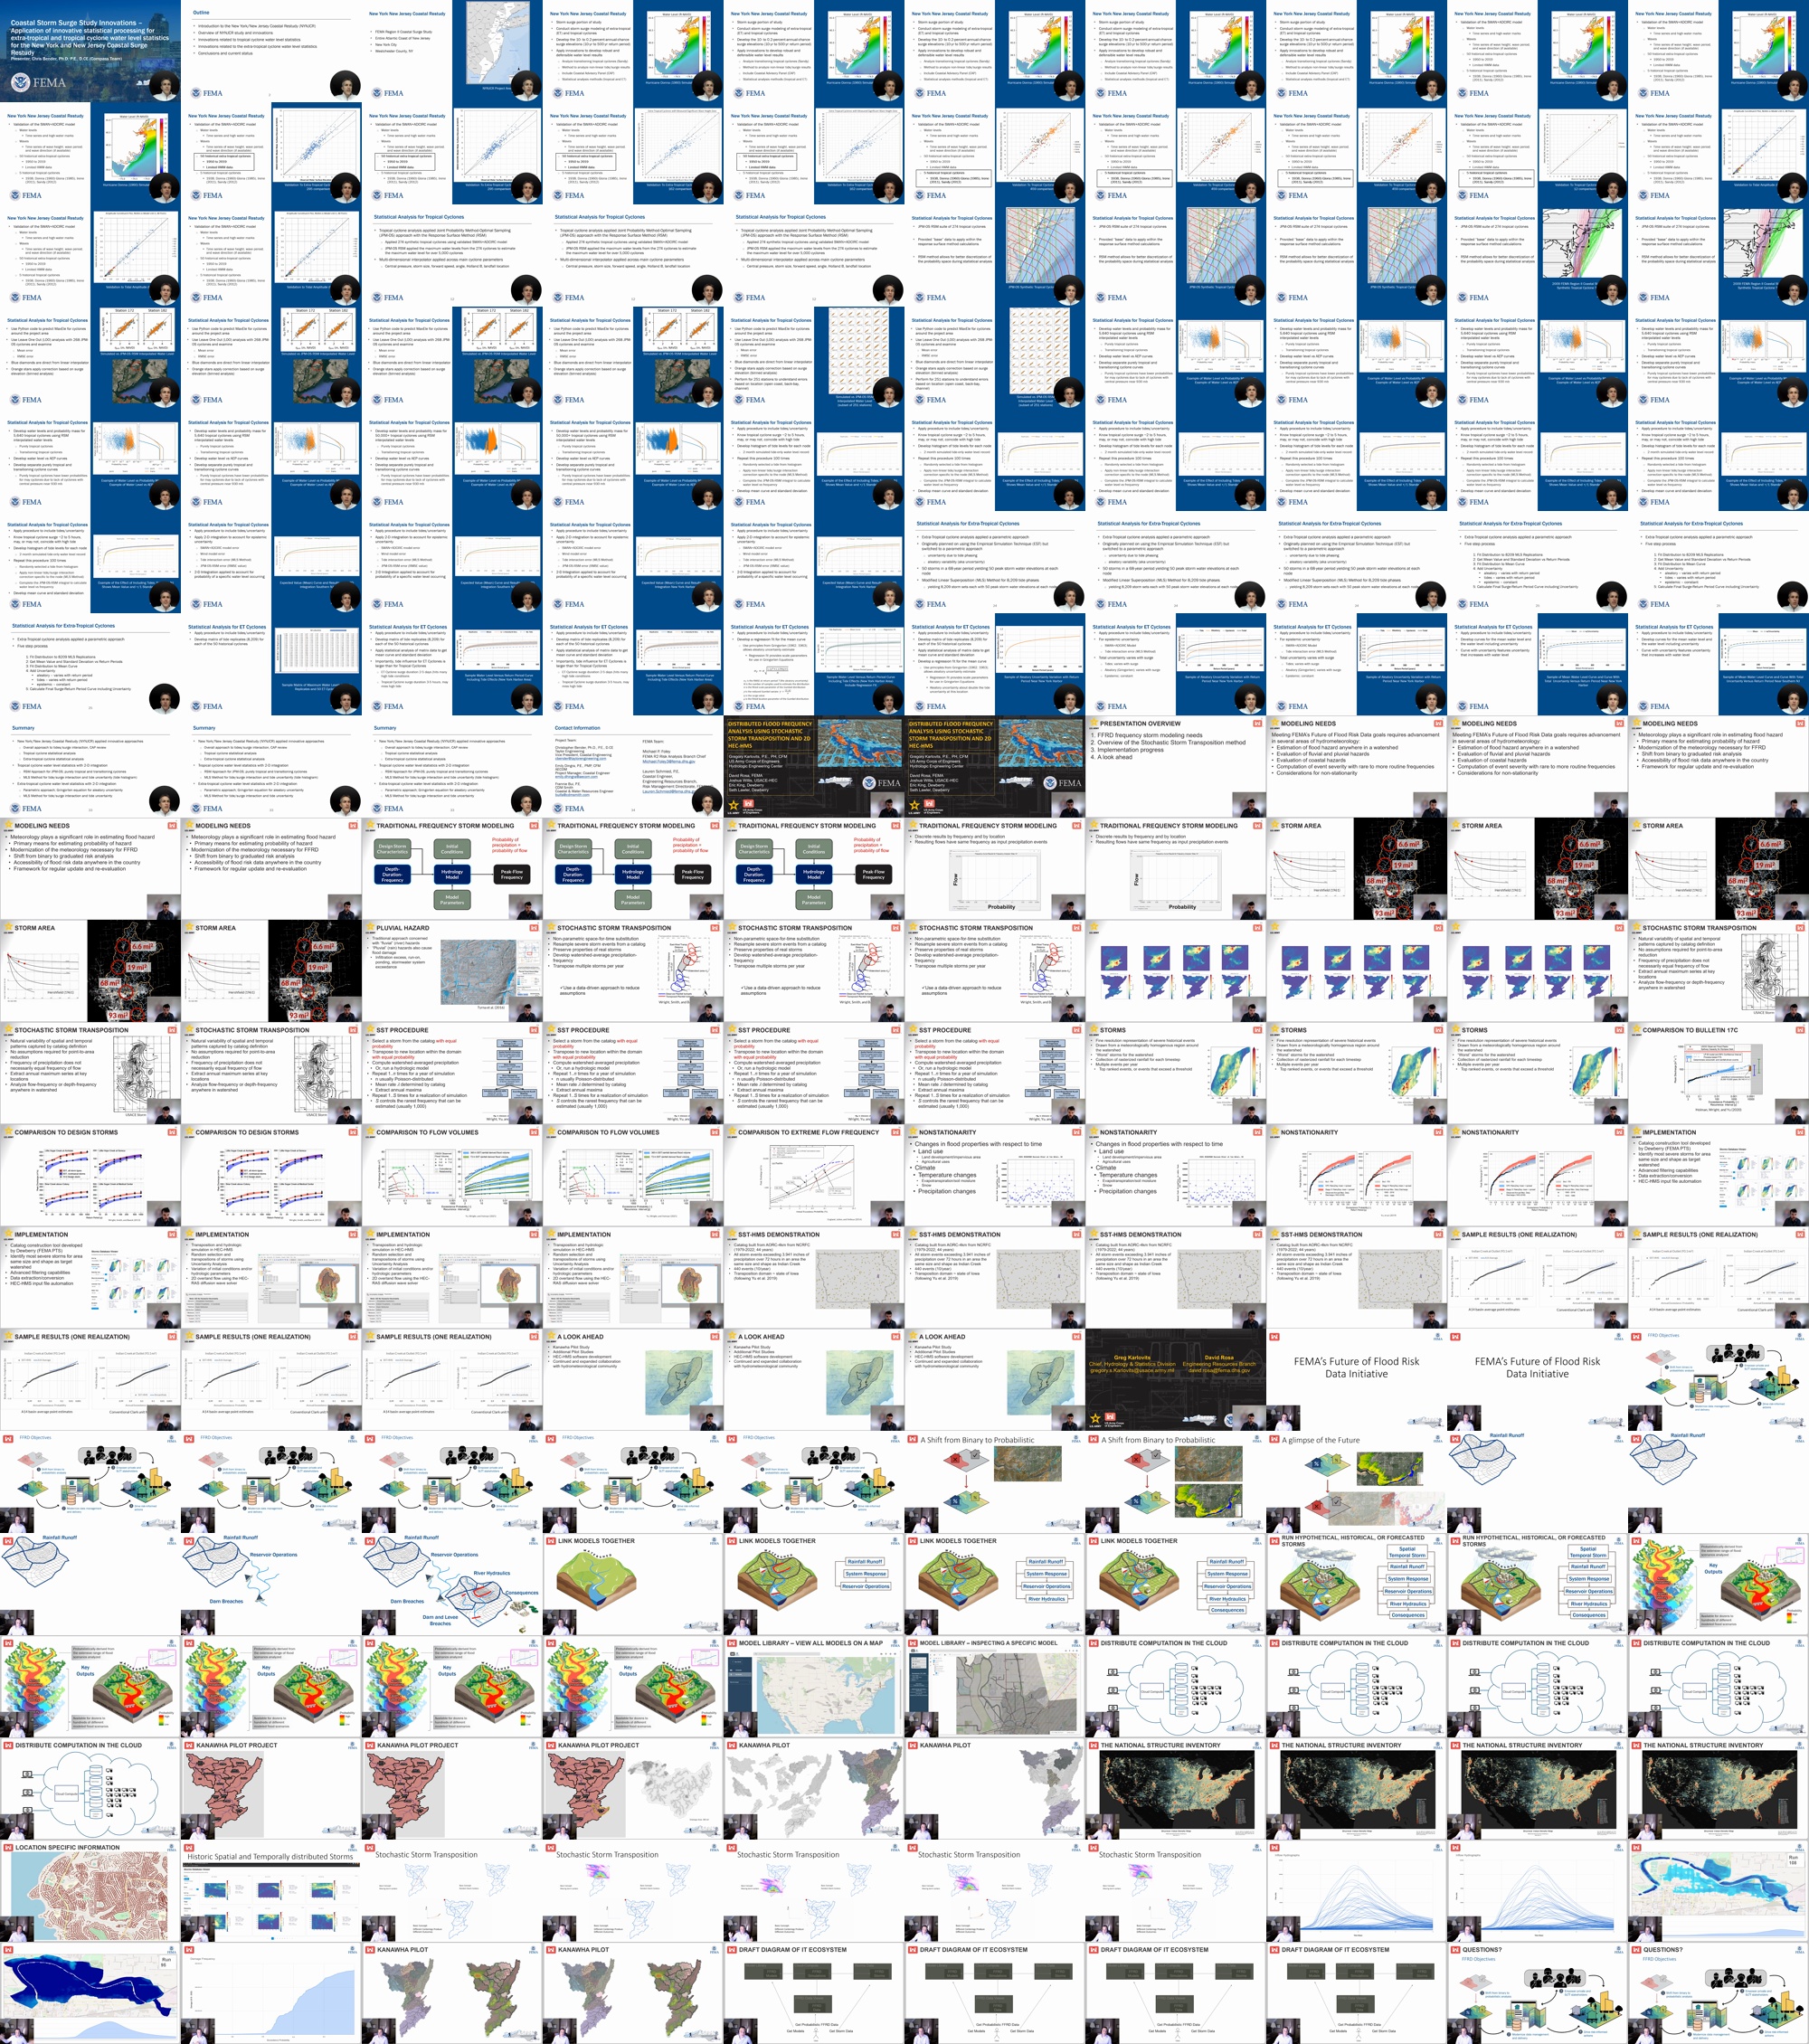
1) Coastal Storm Surge Study Innovations – Statistical processing for FEMA Region II
Christopher Bender, Ph.D., P.E., D.CE, Taylor Engineering, cbender@taylorengineering.com
Co-presenters: None
Abstract: This presentation will share innovations related to the statistical processing of cyclone-generated water levels for the FEMA New York and New Jersey Coastal Restudy (NYNJCR). The NYNJCR developed updated water levels and waves for the NYNJCR project area with results applied in follow-on studies to produce updated Flood Insurance Rate Maps (FIRMs). The methods allow robust estimates of water levels for high-frequency to low-frequency levels, which is critical to estimating coastal risks. To develop the water levels, the NYNJCR included resolved hydrodynamic and wave modeling for both extra-tropical cyclone and tropical cyclone water level forcing. For the extra-tropical cyclone water level statistics, the study team developed and applied an approach that accounted for aleatory uncertainty from the historical record length and epistemic uncertainty from the surge model errors. The approach also included uncertainty related to the tidal forcing caused by the relatively large tide range in the region. The local tides interact with the long duration surge produced by extra-tropical cyclones (often exceeding 12 hours, and sometimes 24 hours). The tide approach included a novel way of developing site-specific values for the non-linear deviation of tides and cyclone surge. The tropical cyclone water level statistics applied a Joint Probability Method Optimal Sampling (JPM-OS) Response Surface Method (RSM) that accounts for the nuances of the NYNJCR project area that features a large change in the shoreline orientation near Sandy Hook and Jamaica Bay along with open coast, back-bay, and riverine areas. The processing of the water level data from the JPM-OS RSM simulations applied a multi-dimensional interpolator across the five main cyclone parameters (central pressure, size, angle, forward velocity, and Holland B). The approach applied 268 JPM-OS synthetic simulations and developed results for a more complete parameter space with errors (mean and root-mean-square) calculated at each calculation node.
2) Distributed Flood Frequency Analysis Using Stochastic Storm Transposition and 2D HEC-HMS
Gregory Karlovits, PE, PH, CFM, US Army Corps of Engineers, gregory.s.karlovits@usace.army.mil
Co-presenters: Eric King; eking@dewberry.com; Joshua Willis; joshua.r.willis@usace.army.mil; David Rosa; david.rosa@fema.dhs.gov
Abstract: Stochastic Storm Transposition (SST) coupled with 2-dimensional hydrologic modeling can be used to produce estimates of probabilistic flood hazard at any location within a watershed. Traditional design storm modeling approaches based on point precipitation frequency products have limiting assumptions that may be overcome using the SST-based approach. We applied SST to a 2-dimensional HEC-HMS model of a mixed agricultural-urban watershed in Iowa. We developed a storm catalog consisting of the most severe 72-hour rainfall accumulations over an area with the same size as the target watershed. Hourly storm grids from the period of record of the AORC precipitation dataset (Kitzmiller, et al. 2018) were used as the basis for the storm events. We simulated multiple realizations of 1,000-year traces to estimate flood flows and runoff depths from 1/2 to 1/1,000 annual exceedance probability. Each year within a realization contained a random number of storms drawn from a Poisson distribution, and each storm was randomly selected with equal probability from the storm catalog. Storms were randomly placed within the transposition domain, and then simulated in HEC-HMS. Peak streamflow and spatially-distributed maximum runoff depth were extracted from each event. The simulated annual maximum streamflow for key damage areas in the watershed were compared to regional peak streamflow regression equations. To aid communication of pluvial flood hazard, a spatially-distributed estimate of annual maximum precipitation excess was constructed. The results are expected to inform risk communication, graduated estimates of probabilistic flood hazard, and mitigation planning in support of FEMA's Future of Flood Risk Data Initiative. This presentation will demonstrate a data-driven modeling approach to estimating fluvial and pluvial flood hazard at any location within a watershed.
3) National Scale Risk Modeling Foundational Data and Frameworks
Will Lehman, USACE, William.P.Lehman@usace.army.mil
Co-presenters: David Rosa, david.rosa@fema.dhs.gov; Christina Lindemer, Christina.lindemer@fema.dhs.gov
Abstract:The Hydrologic Engineering Center’s Watershed Analysis Tool (HEC-WAT) is a framework for integrating scientific numerical modeling software programs through plugins. The framework facilitates the sequential running of these plugins, preserving the linkages of inputs and outputs for a user specified number of iterations. The iterations of the computation are used to perform Monte Carlo analyses to support risk assessments. HEC-WAT distributes the computational burden to remote processes to reduce the time required to complete the Monte Carlo analysis and other computational burdens. FEMA’s Future of Flood Risk Data (FFRD) Initiative aims to facilitate the transition to a risk-informed National Flood Insurance Program through the generation of probabilistic, graduated flood hazard and risk information. Through FFRD, FEMA and USACE are developing the methodology to implement a national scale risk modeling effort. FEMA is currently leveraging HEC-WAT for a FFRD pilot study to facilitate the linking of statistical storm generation, hydro-meteorological processes, reservoir operations, hydraulic modeling, and consequence estimation. The pilot will inform methodology and application to all basins in the United States and Territories. The FFRD initiative and the HEC-WAT modeling framework will utilize, as well as produce, foundational, national scale datasets. Initiatives like the 3D Elevation Program (3DEP) provide valuable datasets from which 2-Dimensional computational meshes can be generated. Likewise, datasets such as the National Levee Database and the National Inventory of Dams provide foundational data regarding the infrastructure that impacts the flow of water in our nations streams and rivers. Building on existing datasets and developing new ones requires interagency coordination. Identifying and addressing data gaps should be done in coordination to limit duplication, missed opportunities, and unidentified needs. This presentation provides an overview of the FFRD initiative and its planned use of HEC-WAT.
Contributors
-
Christopher Bender
Christopher Bender a Vice President at Taylor Engineering in Jacksonville, FL where he leads the Coastal Engineering Group. Chris's work has focused on coastal processes analysis, beach design, and storm surge and wave modeling. Prior to joining Taylor, Chris obtained his master’s and doctoral degrees from the University of Florida. Chris is certified as a Diplomate in Coastal Engineering by the ASCE and is a part-time faculty member at the University of North Florida.
-
Gregory Karlovits
Greg is the Senior Technical Specialist for Statistical and Hydrologic Analysis at the US Army Corps of Engineers Hydrologic Engineering Center in Davis, CA. He is the current team lead for the Hydrologic Engineering Center’s Hydrologic Modeling System (HMS) software. Greg has been with USACE for 12 years, starting with the Rock Island District in 2011, Risk Management Center from 2014-2017, and HEC since 2017. His specialties are in statistical analysis, hydrometeorology, hydroclimatology, and hydrologic modeling.
-
Will Lehman
Will Lehman is a Sr. Risk Analyst at the Hydrologic Engineering Center USACE. He has a Masters in Risk Management from Notre Dame Maryland University and a Masters in Economics from Oklahoma State University. He has lead the Hydrologic Engineering Center’s Watershed Analysis Tool (HEC-WAT) for the last 4 years and specializes in watershed wide risk analysis.